📈 Individual Plots
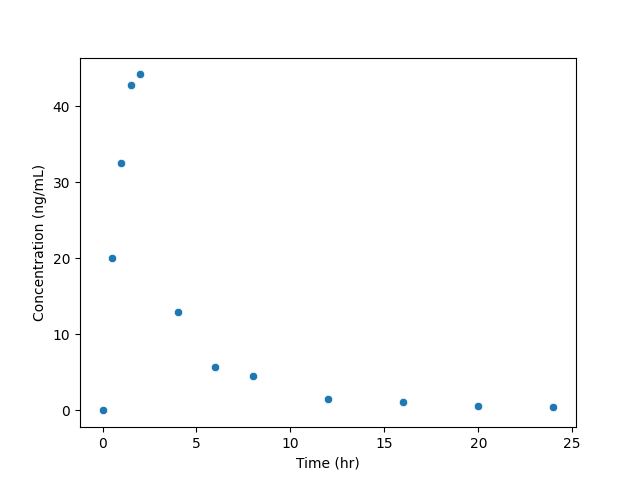
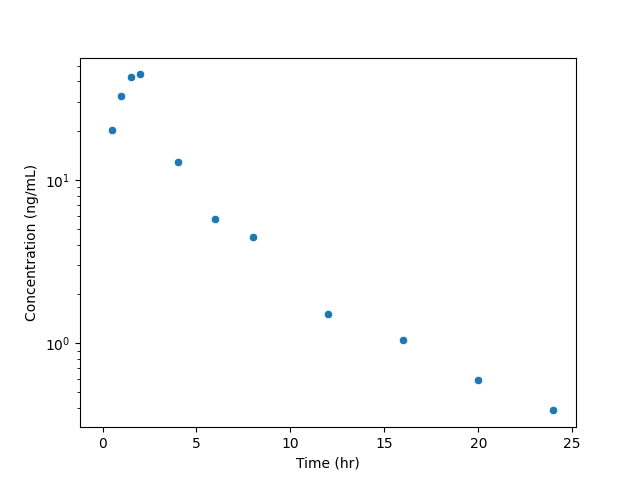
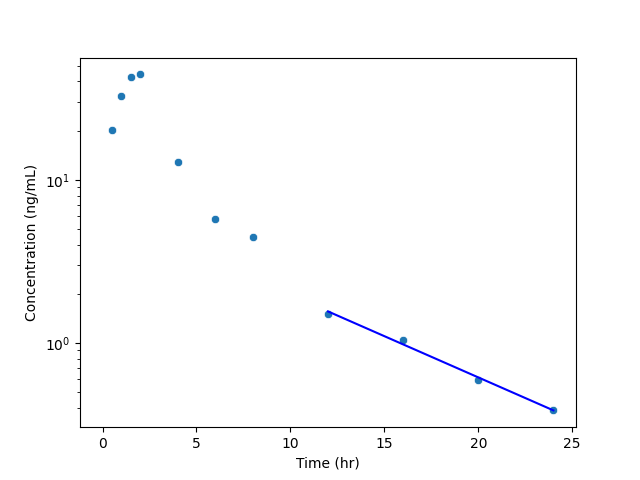
Three separate individual concentration-time plots are produced for each unique profile in the dataset. All plots are saved in the plots 📁 folder of the output. These three plots types are described below.
Linear Plot
This is a plot of the analyzed concentration-time data with a linear y-axis. 
Semilog Plot
This is a plot of the analyzed concentration-time data with a logarithmic y-axis. Concentration values of 0 are not displayed. 
Half-life (thalf) Plot
This is a plot of the analyzed concentration-time data with a logarithmic y-axis, and a line with the best fit terminal slope regression. The best-fit regression only covers that time range used for estimation of the slope. 