Summary Plots
A total of 4 summary plots will be produced for each grouping variable. These are:
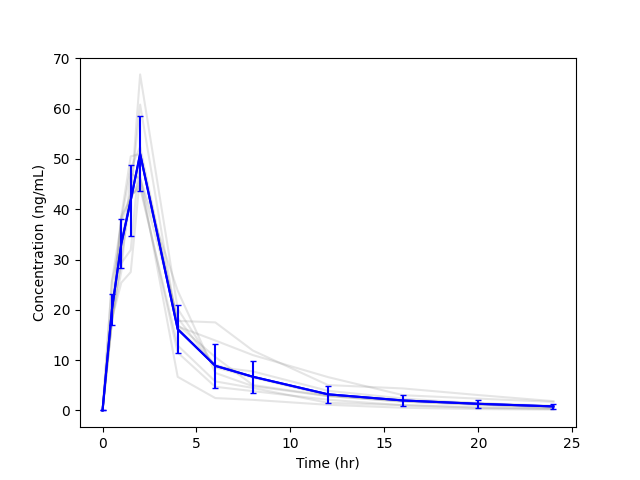
- Linear y-axis with individual subject profiles
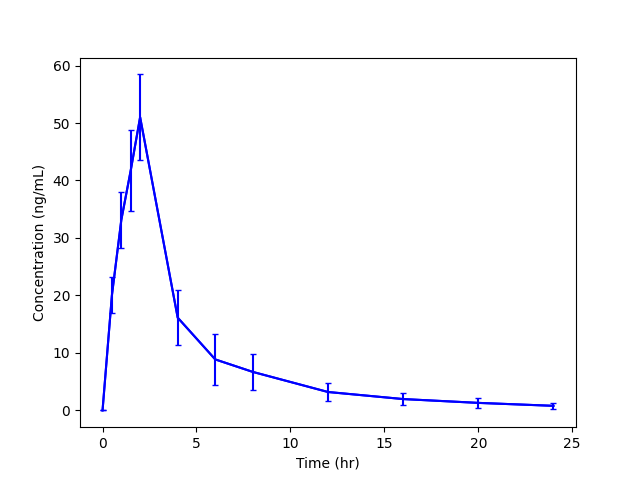
- Linear y-axis with mean profile only
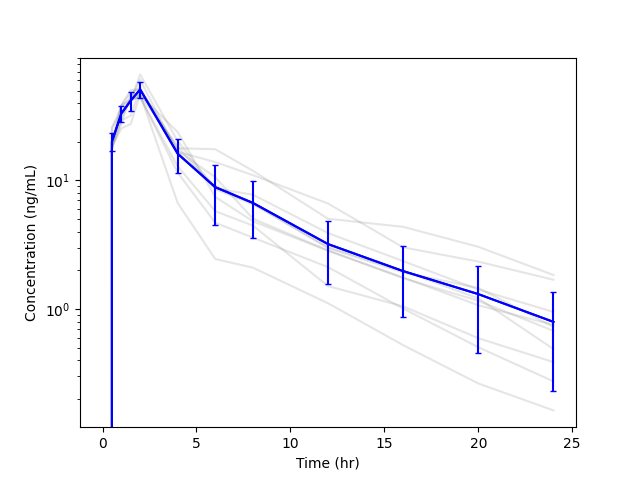
- Logarithmic y-axis with individual subject profiles
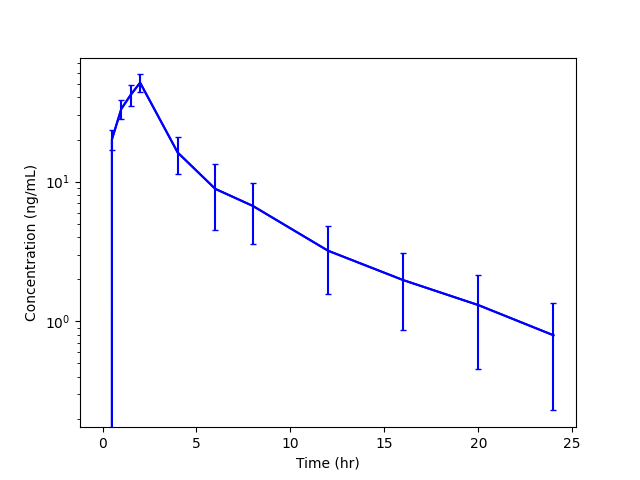
- Logarithmic y-axis with mean profile only
Each summary plot includes the mean and standard deviation of the concentration at each time point. The mean and standard deviation are plotted in blue color and the individual subject profiles are plotted in a light grey color. Summaries are created by binning time points that are similar to one another (e.g. 11.9, 12.0, and 12.1 hours may be binned together for calculation of mean and standard deviation).
As with the Summary PK Parameters, if grouping variable(s) are included in the analysis, multiple summary plots are produced. Please see the Summary PK Parameters page for a description of the summaries that are produced.
Linear Summary Plot with Individuals

Linear Summary Plot without Individuals

Semilog Summary Plot with Individuals

Semilog Summary Plot without Individuals
